The Dashboard page provides an overview of the Discovery operations through informational widgets.
The dashboard automatically saves your widget sizes, layout, and configuration preferences. These settings are reapplied whenever you return to the dashboard. To restore the dashboard to its default state, click Reset Layout.
Welcome
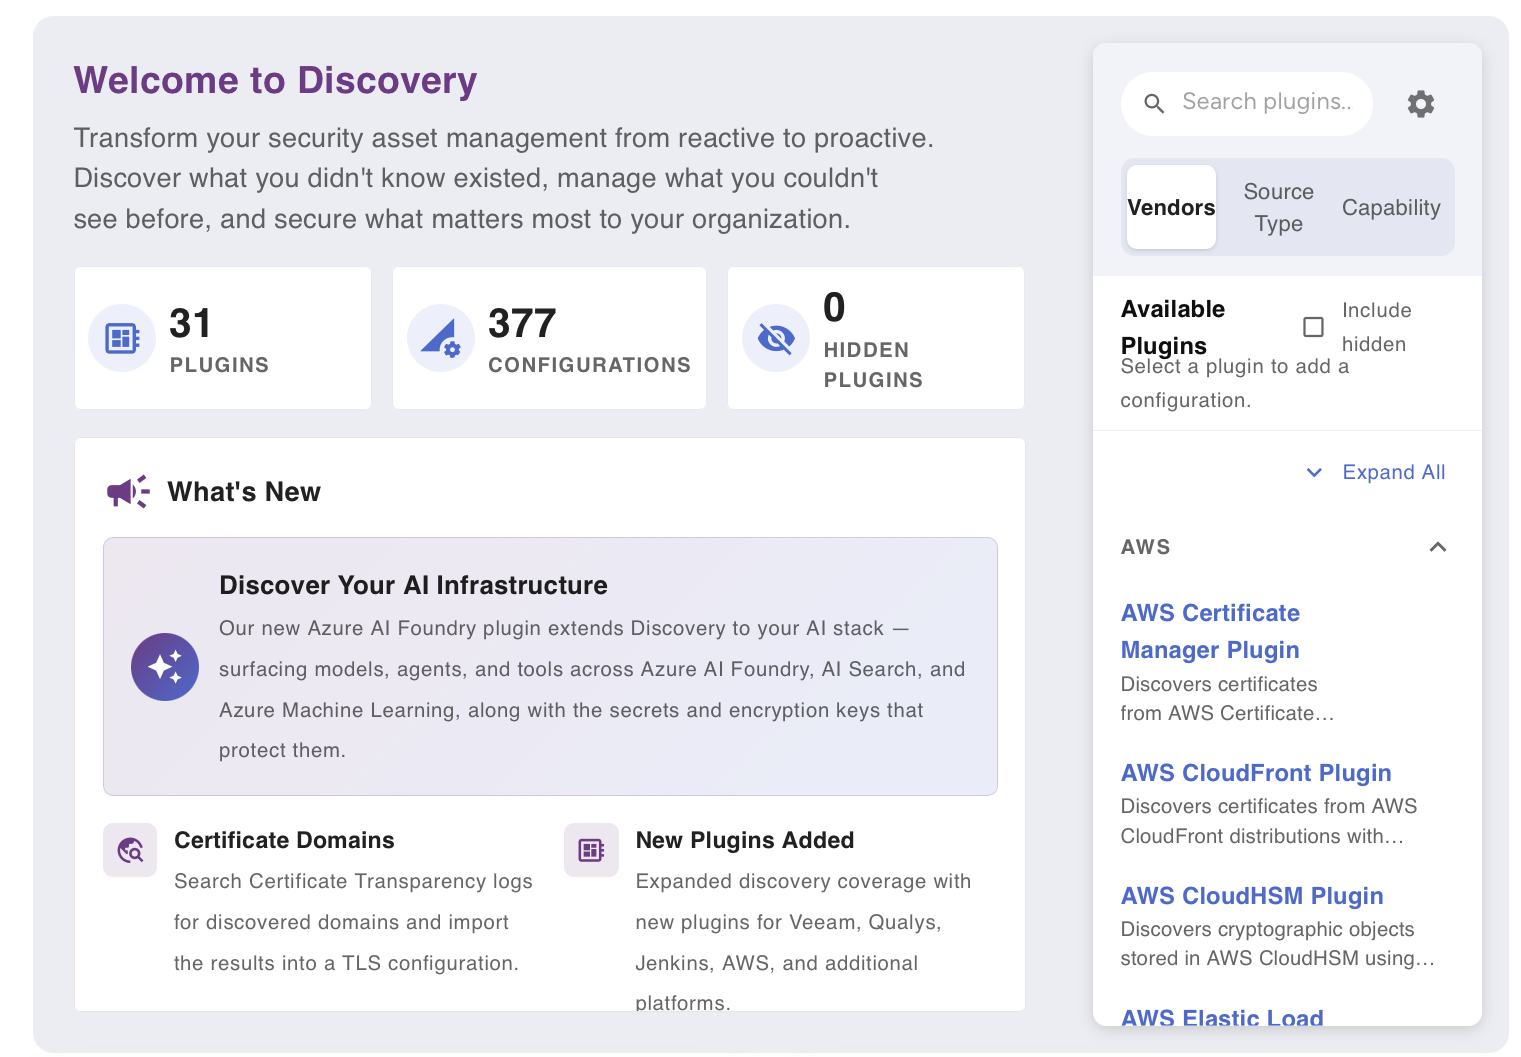
The Welcome widget greets you when you first open your dashboard and helps you get started with configuration setup. Think of it as your launchpad for creating new configurations.
Failed Runs
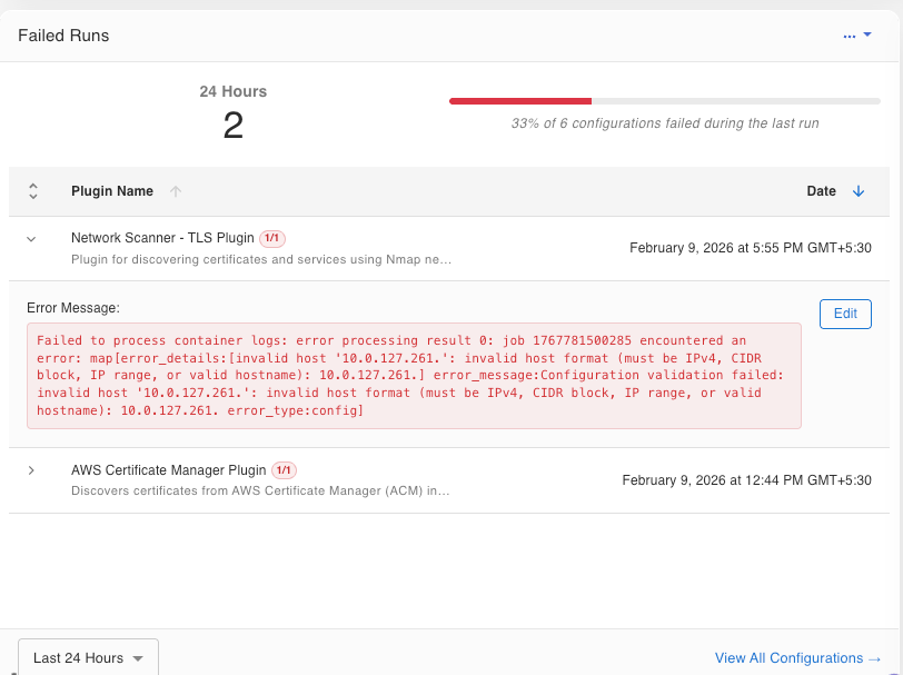
This widget shows which configurations encountered issues during their most recent execution. It acts as a health monitor for your scans, alerting you when problems occur so you can resolve them quickly.
You can:
- Select the icon beside the entry to view error details.
- Click the Edit button to modify that configuration.
- Select a time period from the dropdown at the bottom left to view errors for different ranges.
Run History
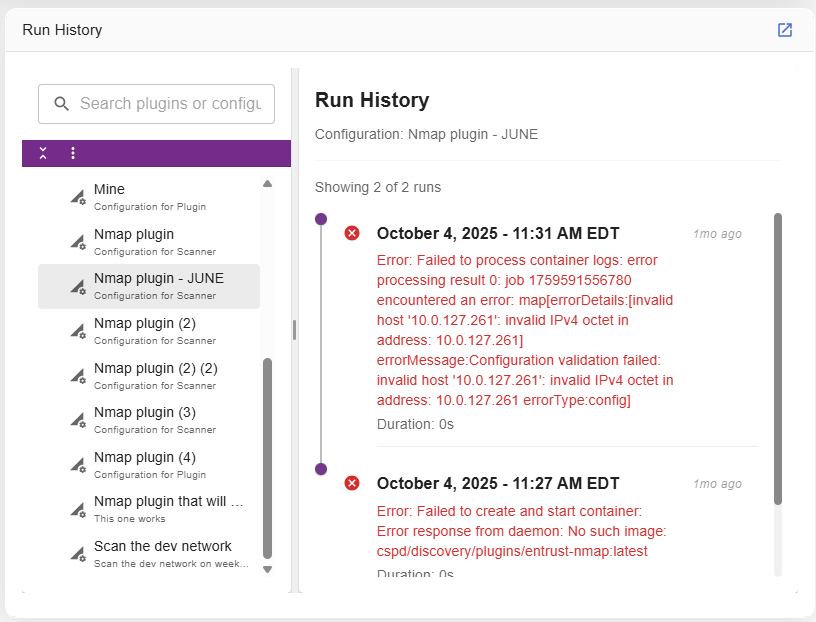
The Run History widget displays the complete execution history for all your configurations. It acts as a logbook and records every scan run. This includes when the run started, how long it took, whether the run succeeded or failed, and the totals of what was found. A scan will appear in this list only after it has finished running.
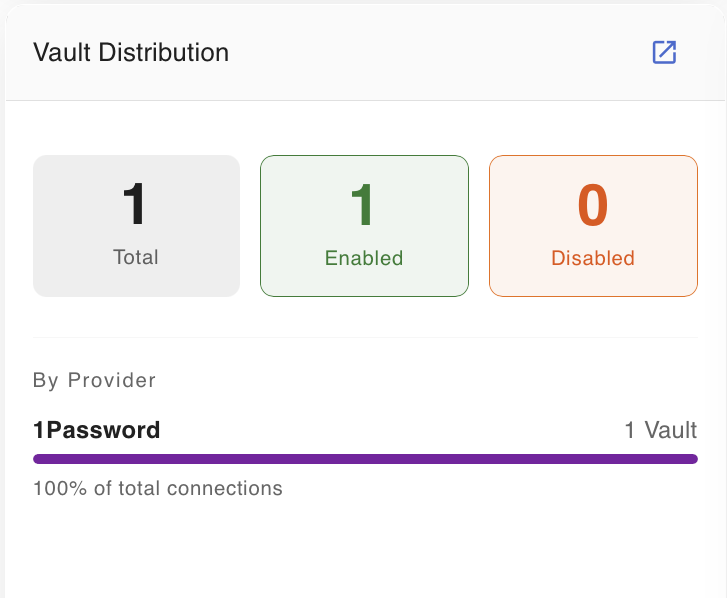
Vault Distribution
The Vault Distribution widget displays the complete vault connections details. This includes the total vault connection count, Enabled vault connections count and Disabled vault connections count.
Vault Health
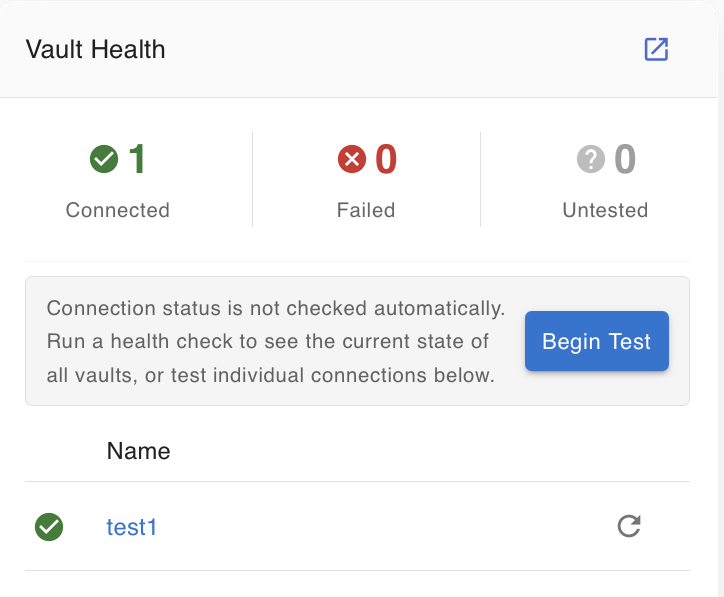
The Vault Health widget displays the complete vault health details. This includes connected count, Failed count and untested count of vault connections.
Note: To run the health check and see the current state of all vaults click the Begin Test button.