With the Grafana Loki Dashboard, users can browse and export logs of the PKI Hub system and the deployed solutions.
To browse and export logs with the Grafana Loki Dashboard
- Click Dashboards in the sidebar of the Grafana portal.
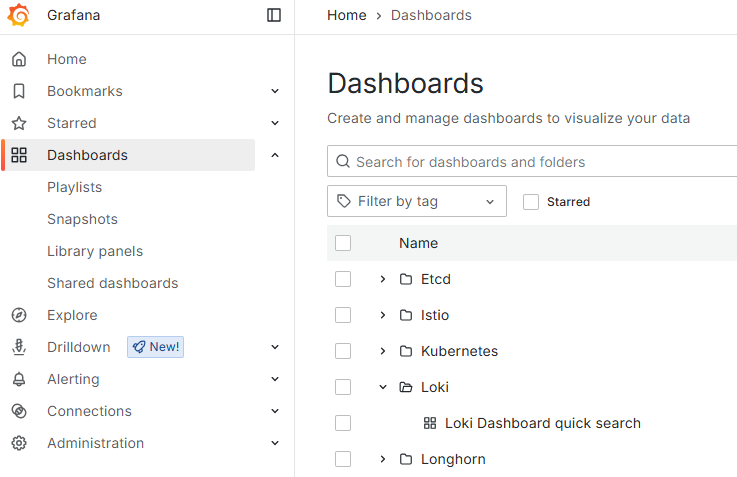
- Select Loki > Loki Dashboard quick search in the content pane.
- Define a log query with the menu options.
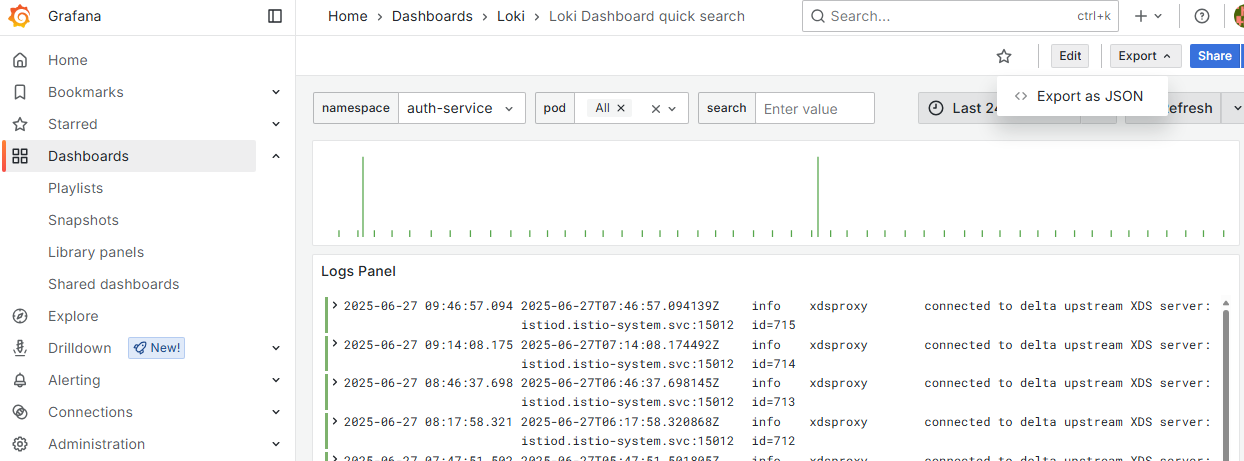
- In the menu bar, select Edit > Export as JSON.
- Click Download file.
namespace
Click namespace in the top-right menu and select the namespace for querying logs.
Namespace | Monitored service |
|---|---|
calico-system | The Calico networking service |
csf-docker-registry | The Docker registry |
longhorn-system | The Longhorn system |
istio-system | The Istio system |
logging | The Log Forwarder solution |
csf-monitoring | The Prometheus service |
csf-logs | The Loki service |
kube-system | The K3s system |
cm | The Certificate Manager solution |
pkihub-v<YYYYMMDDhhmm> | The Certificate Authority solution, version |
cagw | The CA Gateway solution |
ceg | The Certificate Enrollment Gateway solution |
tsa | The Timestamping Authority solution |
eva | The Validation Authority solution |
management-console | The web console for deploying and managing Entrust solutions |
tigera-operator | The Tigera Operator for deploying the Calico networking service |
auth-service | The authentication system for PKI Hub administrators |
solution-manager | The service for managing the deployed Entrust solutions |
pod
Click pod in the top-right menu and select the running pods for which to browse logs.
search
Type a custom log query in the search search box.
Time range
Click the clock icon in the top right menu and select the time range for querying logs.