The Risk Landscape provides a visual representation of the Compromise and Impact levels of cryptographic assets. Use the Risk Landscape to identify groups of assets that might require investigation or remediation.
The Risk Landscape appears on the main dashboard and for individual data sources. It is organized as a 5-by-5 grid:
- Rows represent Impact, with the highest Impact at the top.
- Columns represent Compromise, increasing from left to right.
Each tile shows how many assets sit in that combination of Compromise and Impact bands.
Risk Landscape Section on the Dashboard Page
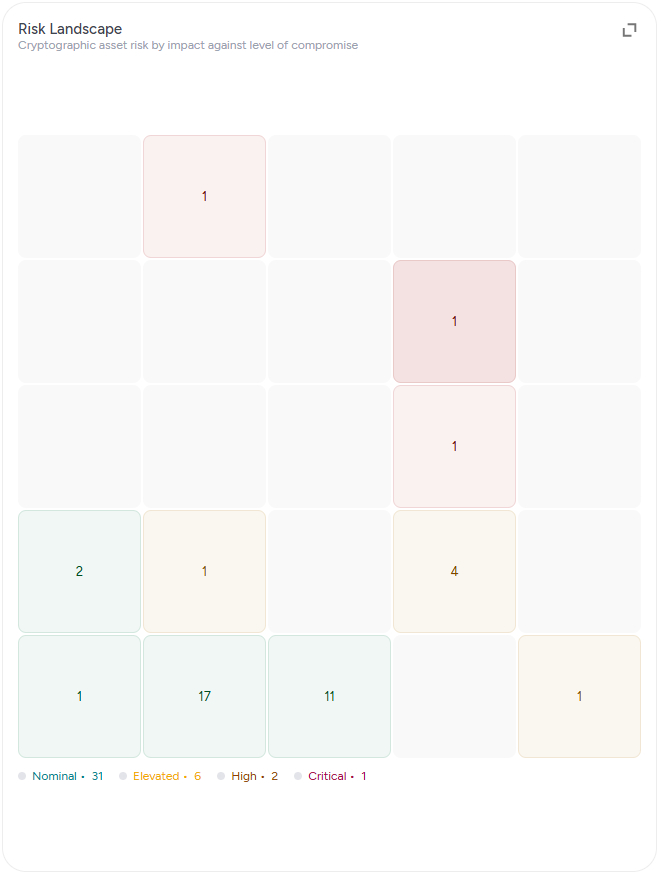
Risk increases toward the upper-right corner of the landscape. Assets in this area have both a high likelihood of compromise and a high potential impact. Assets in the lower-left corner have lower Compromise and Impact levels.
In the Risk Landscape section on the Dashboard page, click the expand arrows at the top right corner to view the detailed Risk Landscape. For more information on the detailed Risk Landscape, see Interpreting the Risk Landscape.
Interpreting the Risk Landscape
The detailed Risk Landscape displays analyzed assets according to business impact and likelihood of compromise. Each populated tile shows the asset count and associated overall risk level.
Detailed Risk Landscape
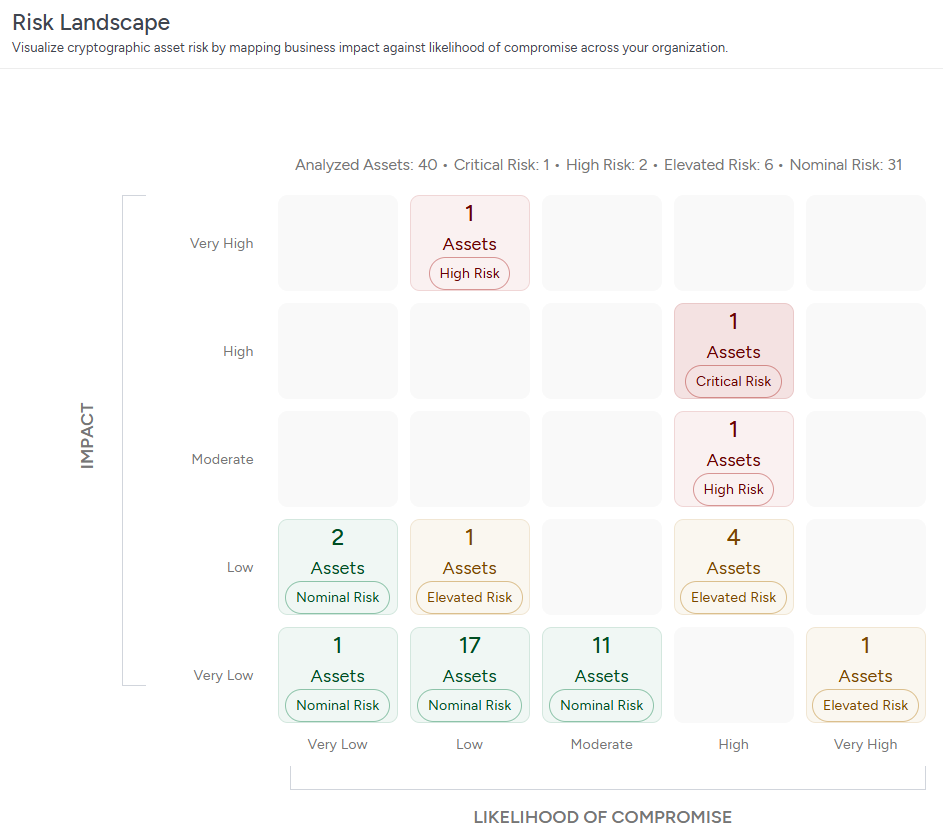
Each tile in the Risk Landscape maps to one of the following overall risk levels. The overall risk level is determined by the combination of the asset's Compromise and Impact bands. For information about Compromise and Impact score ranges and risk bands, see: Understanding Risk.
Overall Risk Levels
Level | Definition | Sample Risk Landscape Tile |
|---|---|---|
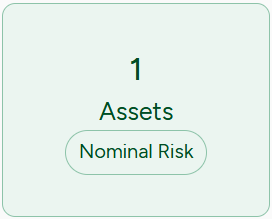
Nominal | The asset does not currently require attention. |
|
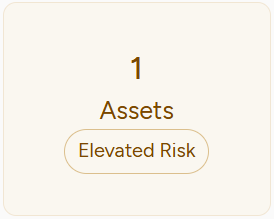
Elevated | The asset is worth reviewing because its likelihood of compromise or potential impact is becoming significant. |
|
High | The asset should be included in current risk-management activities. |
|
Critical | The asset has both significant exposure and significant potential consequences. Address Critical assets first. |
|
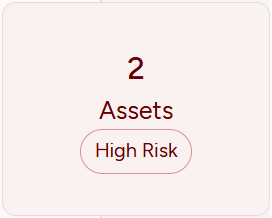
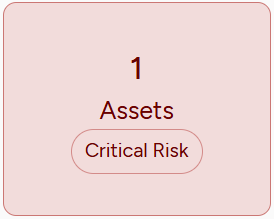
Consider both the position of a tile and the number of assets it contains when interpreting the Risk Landscape.
For example:
- A large number of assets in columns on the right can indicate a widespread cryptographic hygiene issue.
- A large number of assets in rows near the top can indicate concentration risk because many systems depend on important cryptographic assets.
- Assets near the upper-right corner generally require the most attention because they combine high exposure with high potential consequences.
The Risk Landscape is a map rather than a sequential ranking. Use the overall risk levels, tile positions, and asset counts together to identify high-risk asset groups and prioritize remediation activities, typically starting with assets in the upper-right region of the landscape.
Filtering the Risk Landscape
On the Dashboard page, you can filter the Risk Landscape by:
- Data source
- Collection
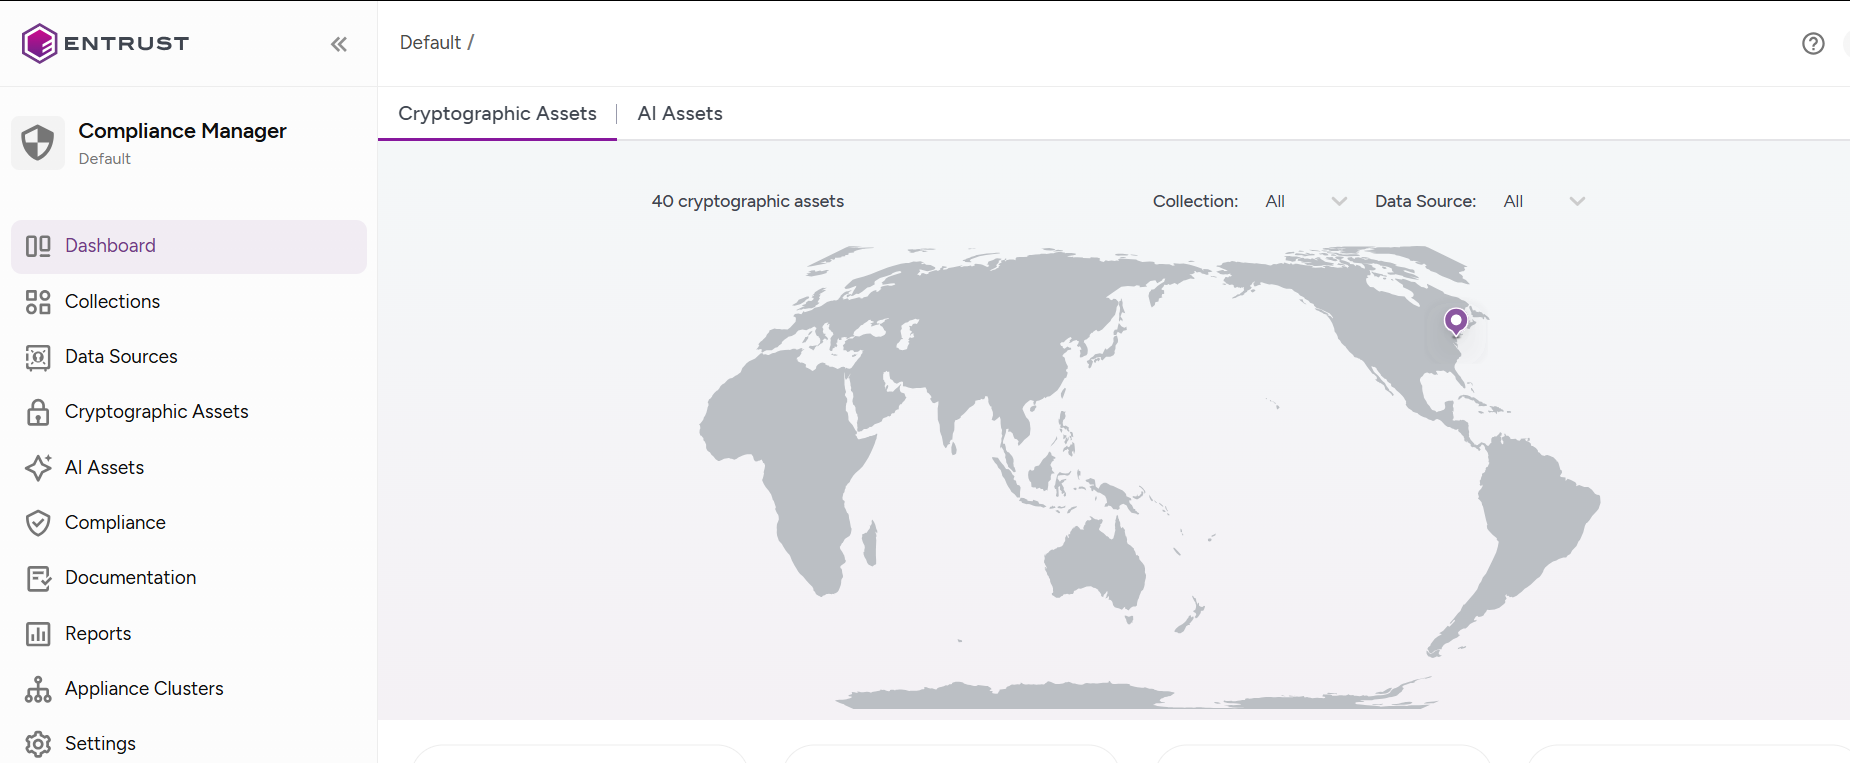
Filtering allows you to focus on the risk information for a particular environment or group of assets.
Viewing information for a Risk Landscape tile
Select a populated tile in the detailed Risk Landscape to view the security recommendations for the assets associated with that combination of Compromise and Impact bands. Each tile represents a risk category.
For information about interpreting and evaluating the recommendations, see: Reviewing Security Recommendations.